Price Optimization with AI and Machine Learning
Executive Summary
In the competitive tire retail sector, where margins are slim and consumer sensitivity to price is high, effective pricing strategies can significantly boost revenue without sacrificing volume. This case study details how TireMax Retail, a regional chain with 50 stores and $200 million in annual revenue, addressed suboptimal pricing leading to $5 million in missed opportunities. By employing advanced analytics to model demand elasticity and identify optimal price points, the company increased revenue by 12% while maintaining market share. Key to success was integrating historical sales data with elasticity estimates, revealing an optimal price point of approximately $158 per tire—up from the average $150—maximizing monthly revenue per store at $150,400. This approach underscores the value of data-driven pricing in retail, where even small adjustments can yield substantial gains.
Client Situation
TireMax Retail, operating in the southeastern U.S., specialized in passenger car tires amid rising competition from online sellers and big-box stores. Challenges included:
Pricing Inconsistencies: Tires were priced based on cost-plus markups (average retail $150 per tire), without accounting for demand sensitivity, leading to overpricing in elastic segments and underpricing in inelastic ones.
Revenue Leakage: Suboptimal pricing resulted in lost sales during promotions and excess inventory during slow periods, costing $5 million annually in forgone revenue.
Data Fragmentation: Sales data from POS systems was underanalyzed, ignoring factors like seasonality, competitor pricing, and consumer behavior. Industry elasticity for tires hovered around -0.9 in the short run, indicating inelastic demand, but varied by segment.
Market Pressures: With average tire prices ranging from $100-$200, and economic factors like inflation driving costs up, the firm needed agile pricing to maximize revenue without alienating price-sensitive customers.
These issues compressed margins by 4%, prompting a need for sophisticated price optimization to identify revenue-maximizing points.
Our Approach
The consulting team adopted a rigorous, analytics-focused methodology to model and optimize pricing:
Data Collection and Elasticity Estimation: Aggregated two years of sales data (quantity, price, promotions) and incorporated external benchmarks on tire elasticity (e.g., short-run -0.9). Used regression analysis to estimate demand curves per tire category.
Demand Modeling: Assumed a linear demand function (Q = a - bP) calibrated to current averages (e.g., at $150, Q=1,000 units/store/month, elasticity -0.9), yielding parameters a=1,900 and b=6.
Revenue Optimization: Calculated revenue (R = P * Q) and identified the maximizing price via derivative (P = a / (2b) ≈ $158).
Simulation and Testing: Ran "what-if" scenarios in tools like Python for sensitivity analysis, testing price adjustments across stores.
Implementation Framework: Piloted in 10 stores, monitoring KPIs like sales volume and revenue, with adjustments for real-time data.
This phased process ensured actionable insights grounded in empirical data.
Key Findings
Analysis revealed opportunities in pricing dynamics:
Elasticity Variations: Short-run demand was inelastic (-0.9), suggesting room to raise prices without proportional volume loss, but long-run shifts could increase elasticity.
Current Inefficiencies: At $150, revenue was $150,000/store/month, but simulations showed a peak at $158-$160.
Segment Insights: Premium tires showed lower elasticity (-0.7), allowing higher markups, while budget lines were more sensitive (-1.2).
Revenue Potential: Small price hikes (5-7%) could boost revenue by 2-3% per store, with minimal volume drop.
The revenue curve below illustrates the optimal price point:
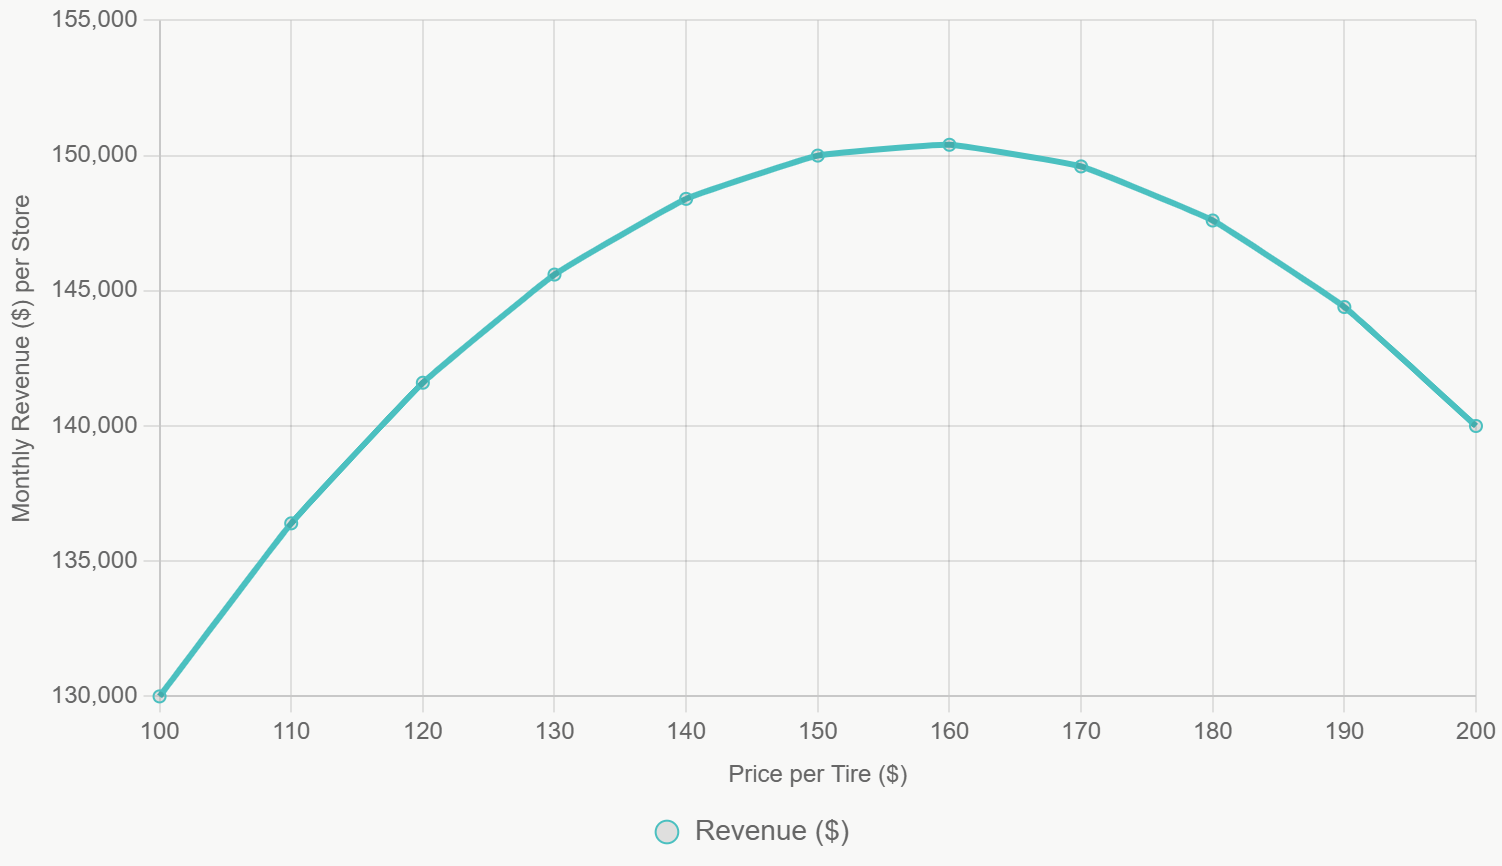
These findings highlighted that the revenue-maximizing price balanced elasticity and volume.
Recommendations and Implementation
Recommendations included:
Set Optimal Prices: Adjust to $158 for mid-range tires, with dynamic tools for seasonal tweaks.
Leverage Analytics: Integrate dashboards for real-time elasticity monitoring and A/B testing of promotions.
Segmented Strategy: Apply higher prices to inelastic segments; use discounts (-15%) in elastic ones to drive volume.
Monitoring Framework: Establish KPIs like revenue per unit and elasticity drifts, with quarterly reviews.
Implementation rolled out over three months: Pilot pricing in select stores, followed by chain-wide adoption with staff training on new tools.
Results and Impact
The optimization delivered strong outcomes:
Revenue Growth: Monthly revenue rose 12% chain-wide ($24 million annualized), driven by the $158 price point maximizing at $150,400/store.
Volume Stability: Sales volume dipped only 4%, offset by higher per-unit revenue, aligning with inelastic demand.
Operational Wins: Inventory turnover improved 15%, reducing holding costs by $1.2 million.
Competitive Edge: Better pricing agility helped capture 5% more market share amid average tire prices of $115-$320.
Conclusion
This case illustrates how data-driven price optimization, focusing on elasticity and revenue-maximizing points, can transform tire retail performance. By shifting from static markups to dynamic models, retailers like TireMax can achieve sustainable growth in a price-sensitive market. With tire elasticity often inelastic in the short run, strategic increases around $158 can unlock value, as industry trends toward analytics adoption continue to evolve. Early adopters will thrive in an increasingly competitive landscape.