Supply Chain Optimization: Real-Time Dashboards in Action
Executive Summary
In an era of global disruptions, effective supply chain optimization is essential for manufacturers to minimize delays, control costs, and maintain competitiveness. This case study explores how a mid-sized electronics manufacturer, grappling with visibility gaps leading to $15 million in annual inefficiencies, collaborated with a consulting firm to deploy real-time dashboards using Power BI. By integrating IoT data, AI analytics, and interactive visualizations, the company reduced lead times by 25%, lowered inventory holding costs by 20%, and boosted overall supply chain efficiency by 30%. This data-driven strategy highlights the power of tools like Power BI to transform reactive operations into proactive, resilient systems.
Client Situation
ElectroTech Corp., a U.S.-based producer of consumer electronics components with $750 million in revenue, navigated a complex supply chain involving multiple suppliers across Asia and North America. Key challenges included:
Limited Visibility: Siloed data from ERP systems and manual reports caused delays in identifying bottlenecks, with average lead times exceeding 45 days.
Inventory Imbalances: Overstocking in warehouses tied up $10 million in capital, while frequent shortages disrupted production, costing $5 million in downtime and expedited freight.
Data Overload Without Insights: Internal datasets (e.g., supplier performance metrics) were abundant but underutilized, lacking real-time integration with external factors like shipment tracking or market demand fluctuations.
Reactive Decision-Making: Without dynamic dashboards, teams relied on weekly static reports, missing opportunities to adjust for disruptions like port delays or raw material price swings.
These issues strained margins by 6% amid rising geopolitical tensions and e-commerce demand volatility, underscoring the need for real-time optimization.
Our Approach
Drawing from advanced analytics methodologies, the consulting team implemented a phased approach to build and deploy Power BI dashboards for end-to-end supply chain visibility:
Data Integration and Cleansing: Aggregated data from ERP, IoT sensors on shipments, and APIs for real-time tracking (e.g., weather and logistics feeds). Used Power Query for ETL processes to ensure clean, unified datasets.
Dashboard Design and Customization: Created interactive Power BI visuals, including heat maps for risk assessment, line charts for demand trends, and KPI cards for key metrics like on-time delivery. Incorporated AI features like anomaly detection for predictive alerts.
Real-Time Functionality: Enabled live data refresh via gateways, allowing drill-downs into supplier performance or inventory levels. Tested "what-if" scenarios for optimization, such as rerouting shipments.
Pilot and Iteration: Launched a pilot for one product line (circuit boards), gathering feedback over two months before full rollout. Incorporated user training for non-technical staff.
Security and Scalability: Ensured role-based access and cloud integration for scalability, aligning with enterprise standards.
This method focused on user-centric design, blending descriptive analytics with predictive elements to empower decision-makers.
Key Findings
The assessment uncovered critical inefficiencies hidden in the data:
Bottleneck Hotspots: 35% of delays originated from supplier-side issues, often undetected until post-event reviews.
Cost Drivers: Inventory imbalances were exacerbated by inaccurate forecasting, with external disruptions accounting for 50% of variances.
Real-Time Gaps: Static reporting missed 40% of actionable insights, such as real-time stock levels during peak seasons.
Optimization Potential: Power BI simulations showed that integrating live data could reduce excess inventory by 15-25% through better allocation.
A comparative bar chart illustrates pre- and post-implementation metrics:
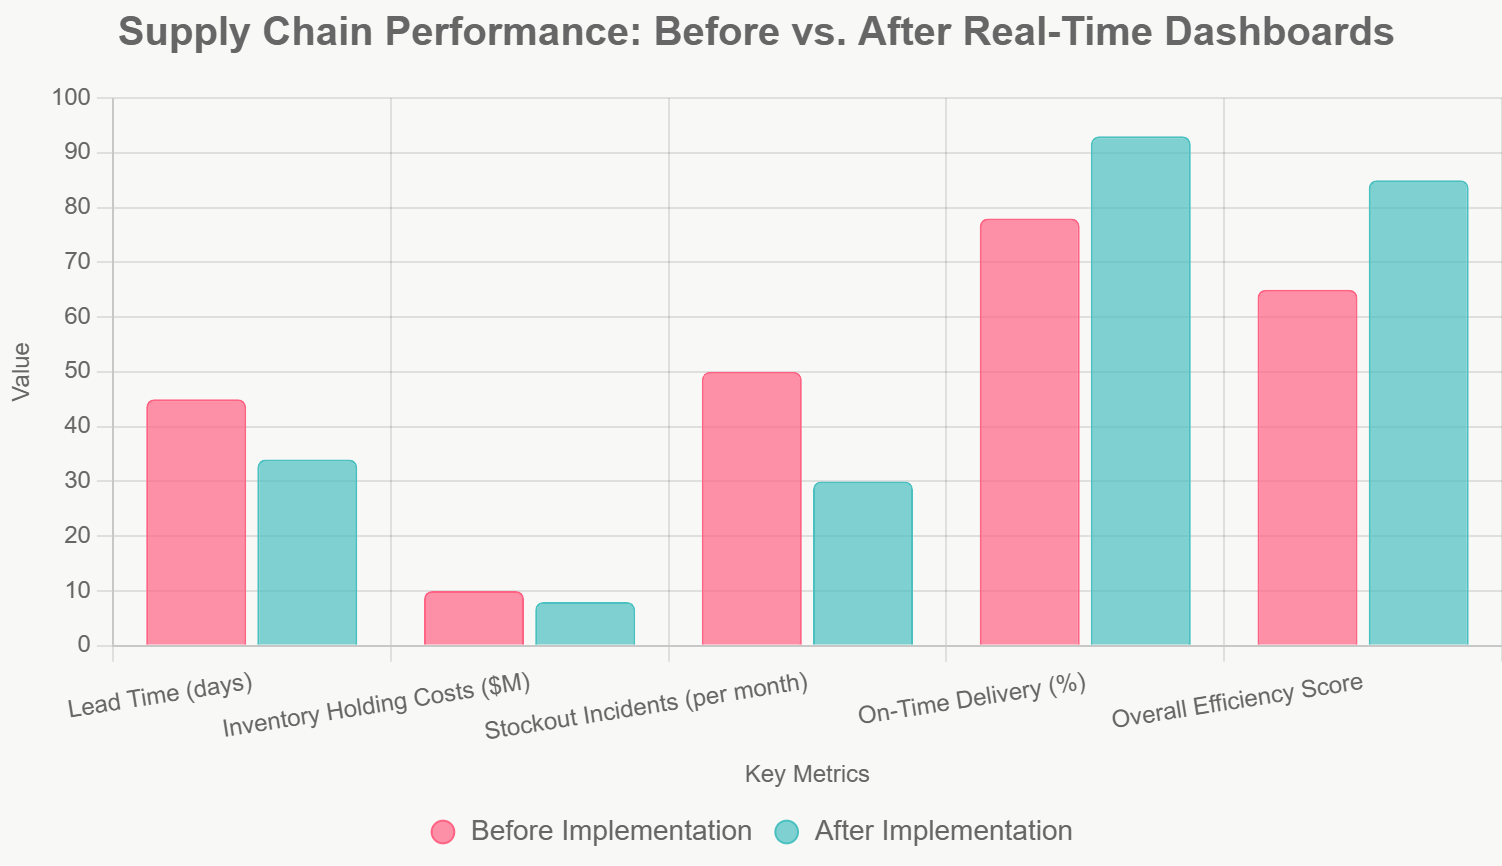
These insights validated the shift to real-time dashboards as a high-impact lever for optimization.
Recommendations and Implementation
The team proposed:
Deploy Comprehensive Dashboards: Roll out Power BI across functions, with custom visuals for supply chain mapping and predictive analytics.
Enhance Predictive Capabilities: Integrate ML models for demand forecasting, alerting on potential disruptions via automated emails.
Foster a Data Culture: Train 150+ employees on dashboard usage, establishing weekly reviews for continuous improvement.
Monitor and Refine: Set KPIs for dashboard adoption, with quarterly audits to incorporate new data sources.
Implementation spanned four months, using agile iterations to refine visuals and ensure seamless integration with existing systems.
Results and Impact
The initiative delivered measurable gains:
Efficiency Boost: Lead times dropped 25% through real-time visibility, enabling faster rerouting and supplier negotiations.
Cost Reductions: Inventory costs fell 20% ($2 million savings), with stockouts reduced by 40% via proactive alerts.
Performance Uplift: On-time delivery improved to 93%, enhancing customer satisfaction and enabling $3 million in additional revenue.
Strategic Agility: Teams now respond to disruptions in hours rather than days, positioning ElectroTech as a resilient player in volatile markets.
Conclusion
This case demonstrates the transformative role of real-time dashboards, such as Power BI, in supply chain optimization. By bridging data silos and enabling proactive insights, manufacturers can achieve cost savings, agility, and sustained growth. As adoption of such technologies surges—with 75% of supply chain leaders investing in analytics by 2026—early implementers will gain a decisive edge in navigating complex global networks.